
The evidence of Hypnosis
What follows are snapshots of the brainwaves of somebody experiencing various hypnotic phenomena.
They were captured using the excellent IBVA system. This is a valuable tool for this kind of research, and you can find more out about the system at www.ibva.co.uk.
A text accompanies each picture and you can click on any of the images to see it larger and in more detail.
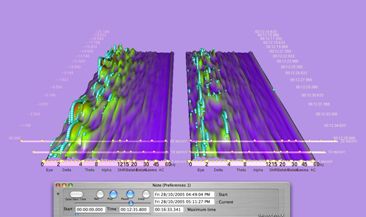
Data type: Frontal lobe EEG stereo (left/right sides)
1. Fully Alert

In this image, where the patient is fully alert, both frontal lobes are producing similar brainwaves with quite high amplitude on the Y axis (showing microvolt units of electricity). Steady streams of beta waves are occurring above 15hz and below 30Hz on both frontal lobes.
This can denote active concentration such as listening intently or visual scanning.
Eye movement and expression cause the large eye spikes and red dots on the far left of each side of the graph, whether the eyes are open or shut.
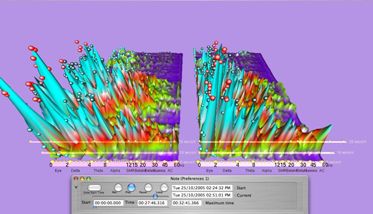
2. Medium focus

Here, the activity has lessened on both sides; only the left is now producing a more definite stream of beta waves under 10 microvolts, implying concentration is more active on this side. The right has lower-strength beta waves without as many round peak indicators, but is now showing the beginning of a succession of low delta waves.
When a subject withdraws from external stimuli, focus begins to turn inwards, beta will lessen and cease, allowing the signs of alpha waves to appear if relaxed and then the slower theta, into delta waves.
3. Deep relaxation
All activity is at lower electricity levels, fewer than 5 microvolts in strength. The brainwaves are much slower - 8Hz and below. Overall this shows steady and slightly undulating waves between 1 and 4Hz (low delta – theta).
These brainwaves do not predominate during normal attention, similar to a certain stage of the human sleep cycle.
4. Awakening
As the waves move back into the horizon of the 3D graph, the gentler and slower waves are replaced with waves of higher amplitude and increased diversity in the foreground.
This shows the change from calmness to arousal, probably with eyes open, as the peaks are much higher now for the eye bandwidths on the X-axis.
5. Abreaction
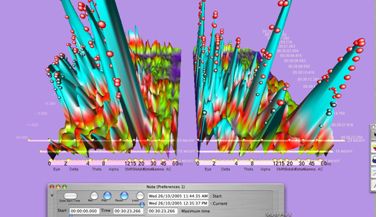
Incredibly high voltage beta brainwaves are visible on both sides. This is too large to be a result of normal conscious awareness, and something is amplifying the activity.
High levels of beta are associated with tasks that are complex, stressful, maybe logical and demanding of all real-time attention. The 0-1Hz eye waves are not showing on the left, so the eyes are likely to be shut or narrowed, as the right side shows some eye activity.
This follows a phase of very high delta and theta waves, those brainwaves can occur with trance or introspection, from a connection to the subconscious. Those thoughts have triggered this stressful appearance as within a few minutes the EEG reading has changed significantly.
6. IMR (during the actual finger-lift)

The diversity of low delta and theta shown here on the right side of the brain seem connected to the subject responding by moving the finger on their left hand over time.